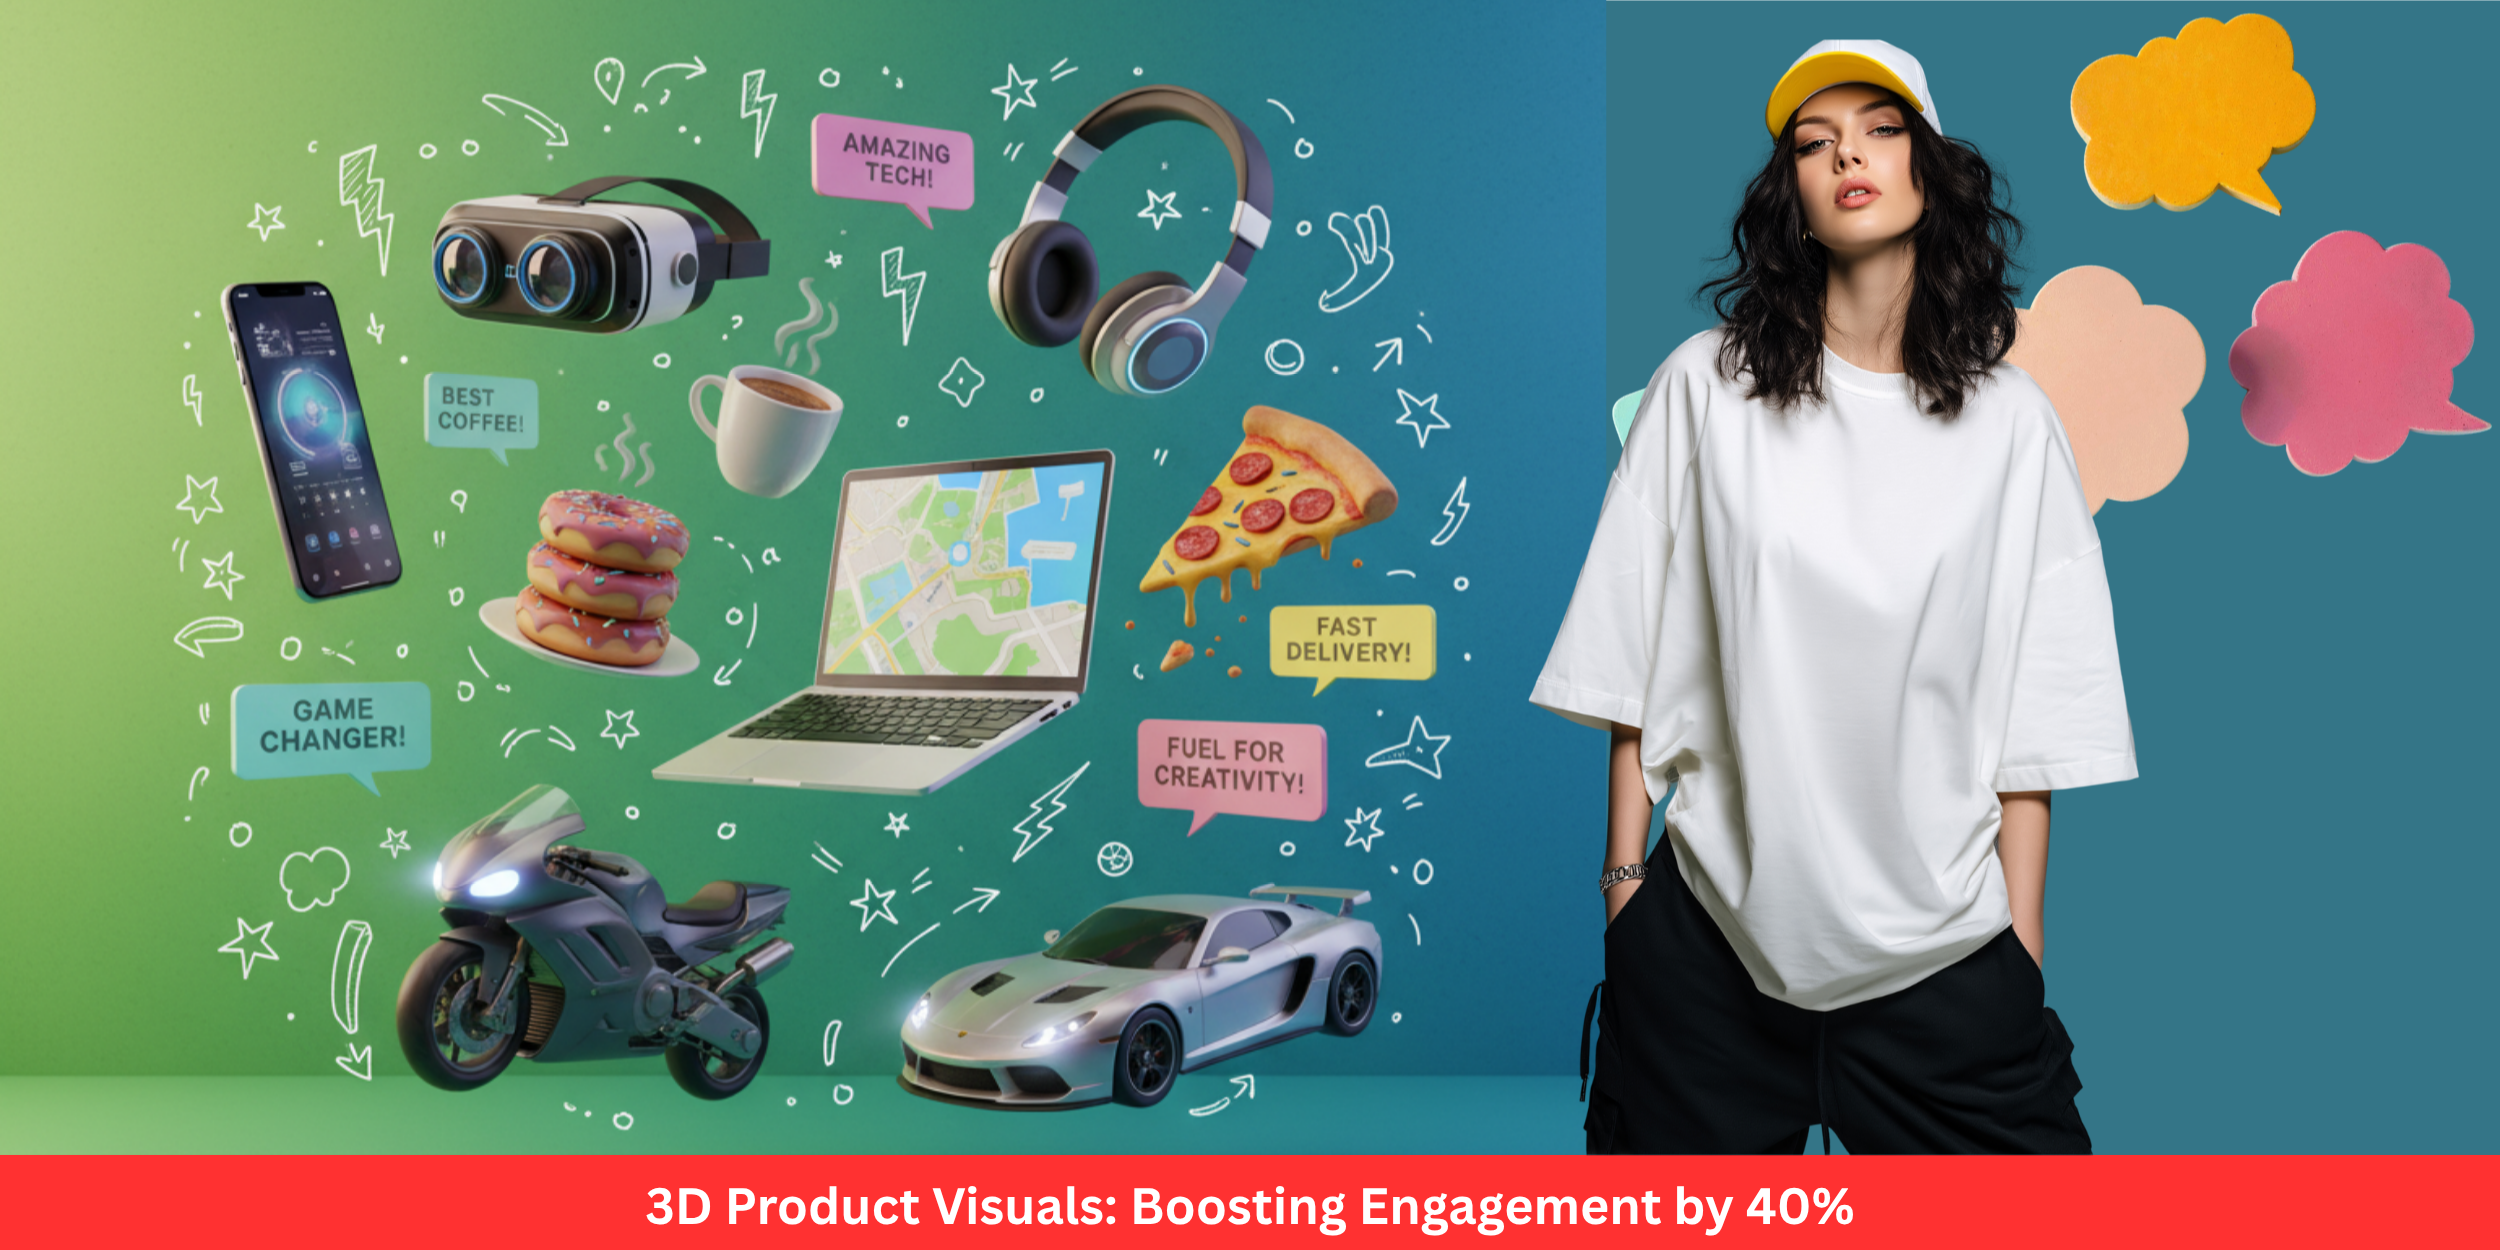
You and I both know how brutal the online marketplace is. A visitor glances, scrolls, maybe clicks and gone. Your product images and descriptions fight for attention, but often fall short. What if you could let customers “touch” your product virtually, spin it around, see it from every angle giving them confidence you rarely get with static photos?
That’s what 3D product visuals invite you to do. They turn passive viewing into interactive exploration. And as many brands are discovering: interactive visuals don’t just look cool they lift engagement, conversions, and trust in meaningful ways.
In this post I’ll walk you through:
Why 3D visuals outperform traditional images
Data that supports the “+40 %” (and more) claim
How to build and integrate 3D visuals into your product pages
Pitfalls to avoid
Frequently asked questions
What to do next (your playbook)
By the end, you’ll see 3D not as a gimmick, but as a powerful lever for engagement and sales.
Why 3D visuals outperform static images & flat graphics
Imagine you’re shopping for a piece of furniture online. A single photograph shows one angle. Another image shows a different angle. Maybe a modest zoom. But you still don’t feel sure: “Is this curve sharp? How thick are those legs? Will it look weird from the back?”
Now imagine instead you can rotate the product in real time, zoom in on details, view texture up close, even change color or material — all in your browser. That’s what good 3D product visuals let people do. They bring agency.
Here’s how that extra agency translates:
More dwell time / interactivity: People spend more time interacting when they feel control.
Better information: You reduce ambiguity. That lowers hesitation.
Emotional connection: It feels like holding the object, even if virtually.
Trust & confidence: When people see more, they worry less.
In a world where attention is currency, 3D visuals offer a richer exchange than flat images ever can.
The numbers behind “+40% engagement” and more
Let’s get into the cold, hard data the kind that helps you pitch, invest, or justify to stakeholders.
Some 3D marketing case studies report ~40 % higher conversion rates compared to traditional marketing (static + video) when 3D interactivity is deployed.
Brands using 3D configurators often see 94 % conversion lifts in some segments.
82 % of visitors to product pages activate the 3D view when available.
34 % of those users interact with the 3D model for more than 30 seconds.
Many retailers report reduced returns by up to 35–40 %, because customers get a better sense of what they are buying.
In one report, interactive 3D visuals delivered 40 % higher conversions compared to traditional visuals.
Other studies suggest that 3D content is preferred over video or static by large margins (e.g. 95 % of users preferring interactive 3D over video playback)
Those numbers vary by product category, quality of implementation, and audience. But the pattern is consistent: 3D visuals move metrics.
Let’s translate that into engagement: if your baseline product page retains a user for, say, 20 seconds, and your bounce is ~70 %, a 40 % lift in “engagement metrics” might mean more users interacting for a minute, more clicks, more scroll depth and more conversions.
So the “3D boosts engagement by 40 %” isn’t a magical claim. It’s grounded in repeated case studies and adoption across e-commerce sectors.
How to build and integrate 3D visuals for product pages
Knowing the upside is half the battle. The real difference lies in execution. Let’s go step by step what you need, what to watch out for, and how to roll out.
Step 1: Choose your visualization type
There are several forms of 3D / interactive product visuals. You don’t have to do them all at once.
360° spin / turntable model: The simplest form. Users rotate around a fixed axis.
3D interactive model: Full freedom — zoom, rotate, tilt, pan.
3D configurator / customization: Users pick options (color, texture, parts) and see the changes real time.
Augmented Reality (AR) + WebAR: Place the 3D product in your own environment (room, desktop) via camera.
Virtual showroom / 3D environment: Users walk around (or navigate) a virtual space with multiple products.
You can start with a turntable or interactive model, then scale to configurator or AR as your infrastructure becomes stronger.
Step 2: Create or source high-quality 3D models
This is the foundation. A low-quality 3D model kills the illusion.
Use accurate dimensions — the “real object in virtual form” must match.
High fidelity texture maps (bump, normal, specular) — material realism helps.
Correct lighting setup — shadows, reflections, ambient occlusion.
Optimization: polygon counts, LOD (level of detail), and proper mesh cleanup so models don’t burden load time.
You can hire 3D modelers or use in-house teams. Many platforms now offer conversion services from product CAD or photographs.
Step 3: Select a rendering / visualization engine
To render 3D in-browser or in apps you need a framework or engine:
WebGL / Three.js: Widely used for browser 3D.
Babylon.js: Another strong WebGL engine.
Unity / Unreal / Unreal’s Web export: For heavier 3D / interactive experiences.
GLTF / GLB: Modern file formats optimized for web 3D.
3D Configurator platforms / SaaS: Tools that abstract much of the engine work and integrate with your CMS / e-commerce backend.
Choose a stack that balances visual quality and performance.
Step 4: Integrate into product pages (UX + performance)
Design matters. Here’s how to integrate without hurting usability.
Place an entry point near the “hero image” / main product image spot.
Lazy-load the 3D viewer only when needed (e.g. on scroll or click), so initial page load stays fast.
Provide fallback static image / 2D for older browsers / devices.
Include intuitive UI: rotate, zoom, reset view, change options, full-screen toggle.
Monitor performance: use metrics like Core Web Vitals (LCP, FID, CLS) to ensure the 3D module doesn’t slow things down too much.
Track analytics inside the 3D viewer: how many users activate it, how long they interact, which angles they choose.
Step 5: A/B test & refine
Don’t just drop it in and hope. Test:
Product pages with vs. without 3D viewer
Different viewer placements (inline vs modal vs overlay)
Preload strategies
Button labels (e.g. “View in 3D” vs “Inspect 360°”)
Different levels of interactivity (spin only vs full)
Refine based on data interaction time, conversion lift, bounce, exit points inside the 3D viewer.
Pitfalls & what kills the magic
3D visuals are powerful but misused, they can hurt more than help. Watch these traps:
Slow loading / lag: If your 3D viewer delays page load, users bail.
Low fidelity models: Unrealistic textures, weird lighting breaks trust.
Overcomplex UI: Too many controls confuse users.
Poor fallback / no fallback: If a user’s browser can’t support WebGL, show them nothing.
No analytics in viewer: Then you don’t know how it’s performing.
Using 3D where it doesn’t add value: For simple, flat products with little visual variation (e.g. plain text-only items), 3D may not justify the cost.
Ignoring mobile / performance constraints: Many users are on mobile make sure 3D visuals degrade gracefully there.
If you avoid those, you’re in a good position to reap the upside.
FAQs
Here are likely questions your readers will ask better to answer them proactively.
Q1: Will 3D visuals work for any kind of product?
Not always. If your product is largely functional and not visual (e.g. a purely digital service, commodity parts), the visual benefits might be marginal. But for physical goods especially furniture, fashion, home decor, tools, gadgets 3D adds clear value. Use test pilots to validate.
Q2: Do I need to build everything from scratch?
No. You can start with 3D providers or SaaS 3D configurator services. Many platforms allow you to plug into WebGL viewers or APIs. Over time, you can bring more in-house or build custom modules.
Q3: What about mobile performance / compatibility?
Yes, this is a key challenge. Use lightweight models, progressive loading, fallback images, and test across device types. Some less-capable devices may disable full 3D and show a simpler 360 spin.
Q4: How expensive is this, compared to traditional photography?
Upfront costs are higher. You pay for modeling, texture work, rendering, integration. But over time, it’s cheaper: no repeated photoshoots, easier variation (color, style), easier versioning. Also, the lift in conversion and reduced returns often pays back the investment.
Q5: How do I measure success?
Key metrics: viewer activation rate, interaction duration inside 3D viewer, bounce/exit rates for pages with 3D vs without, conversion lift (A/B test), change in average order value (if configurator options), reduction in return rates.
Q6: Can 3D visuals hurt SEO or page speed?
Yes, if implemented poorly, they can slow page load, increase bounce, and damage Core Web Vitals. Use lazy loading, optimize models, leverage caching, and monitor performance continuously.
What you do next (your playbook)
You’ve seen the “why,” “how,” and “what to watch out for.” Now here’s a sequence you can execute:
Select one product category (e.g. one SKU line) to pilot 3D visuals.
Commission or build a high-fidelity 3D model (or use your CAD files).
Choose a rendering / viewer tech (Three.js, Babylon, a SaaS provider).
Integrate it into the product page with fallback images.
Instrument analytics: activation, duration, angles used, exit.
Run an A/B test comparing the version with 3D vs traditional images.
Evaluate: Did engagement go up ~+40 %? Did conversions lift? Were returns reduced?
Iterate: improve model / textures, remove friction, speed optimizations.
Roll out to other SKUs gradually, refining the template / component.
Promote: share on social (interactive embeds, teasers), case-study the results.
Conclusion
You don’t have to take my claim at face value: the data shows it. 3D product visuals can (and often do) uplift engagement by ~40 % or more but only if executed well. When your product pages let people explore, control, inspect, and personalize you transform the buyer’s journey.
Treat 3D not as a gimmick, but as a medium not just visual decoration but a bridge between digital and physical decision-making.
Start small. Validate. Scale. And in the process, you’ll see metrics move in your favor: more clicks, longer sessions, better conversions, fewer returns.


